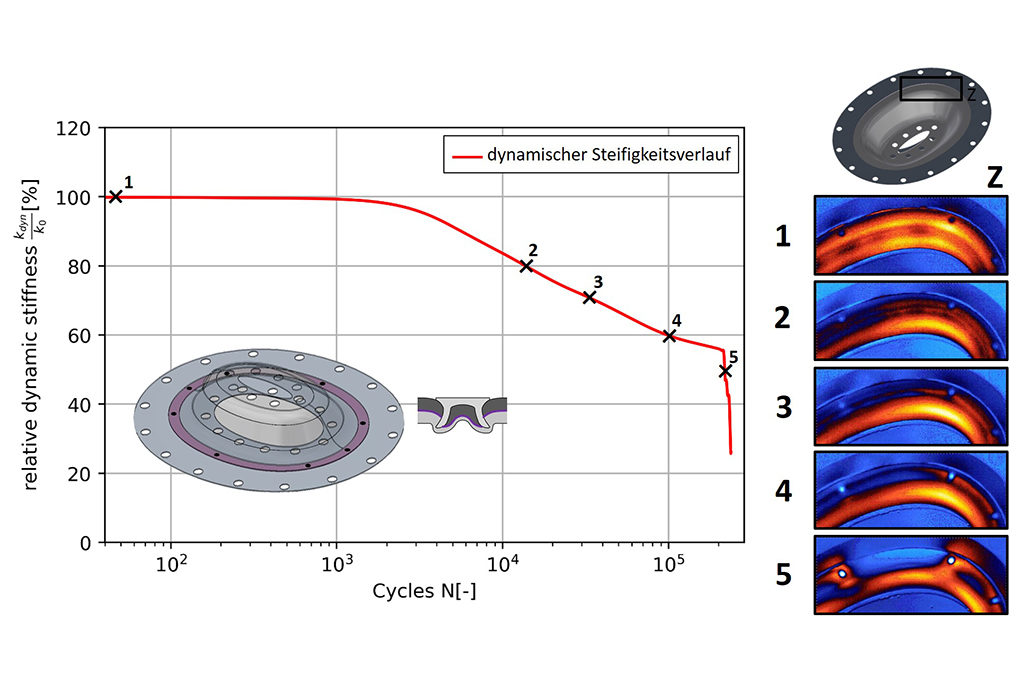
Beispielhafte Darstellung eines Steifigkeitsverlaufs in Korrelation mit thermoelastischer Spannungsanalyse 14. Januar 2021 Bildquelle: Fraunhofer LBF Downloads1024x683 | 300x300 | 600x400 | 768x512 | 1024x683 | 1024x683 | 1024x683